
Both. Use 0.85 for constructs that are conceptually distinct, and 0.90 for constructs that are conceptually similar. But the threshold is now the smaller half of the question — since 2019 the recommended test is not whether HTMT is below the cutoff, it is whether the upper bound of its bootstrap confidence interval is. Plenty of theses still run the old test.
The short answer, if you are mid-analysis right now. Report HTMT against 0.85 unless you can argue the two constructs are conceptually similar, in which case 0.90 is defensible. Then bootstrap it and check the upper bound of the confidence interval against that same value — not against 1.00.
Where 0.85 and 0.90 come from
Both numbers come from Henseler, Ringle and Sarstedt’s 2015 paper in the Journal of the Academy of Marketing Science, which introduced HTMT to variance-based SEM. Neither value was invented for that paper — 0.85 had been proposed by Clark and Watson (1995) and Kline (2011), and 0.90 by Gold et al. (2001) and Teo et al. (2008). What Henseler and colleagues did was test both by Monte Carlo simulation.
The results are worth knowing, because they are the reason your supervisor tells you to stop using Fornell-Larcker:
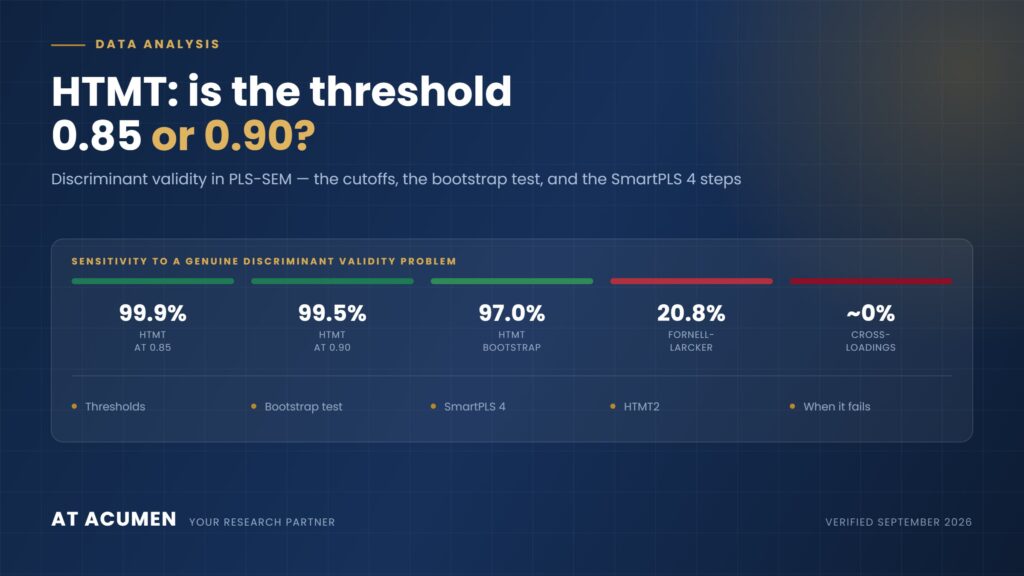
| Criterion | Sensitivity to a genuine lack of discriminant validity |
|---|---|
| HTMT.85 | 99.90% |
| HTMT.90 | 99.45% |
| HTMT inference (bootstrap) | 97.01% |
| Fornell-Larcker criterion | ~20.8% |
| Cross-loadings | ~0% |
Fornell-Larcker misses roughly four out of five real problems. Cross-loadings miss essentially all of them. That is why a reviewer who knows the literature will ask for HTMT even if your thesis template still has a Fornell-Larcker table in it.
The test changed in 2019 — most tutorials did not
This is the part that costs people a revision round.
The old test, from the 2015 paper and repeated in Hair et al.’s second-edition primer, is a two-tailed bootstrap in which you check whether the confidence interval excludes the value 1. A CI containing 1 indicates a lack of discriminant validity.
The current test, following Franke and Sarstedt (2019) in Internet Research, is a one-tailed bootstrap in which you check whether HTMT is significantly below the threshold itself — 0.85 or 0.90. SmartPLS’s own documentation now instructs this, and it is what the third-edition primer’s SmartPLS 4 case studies use.
The difference matters. An HTMT of 0.88 will comfortably pass a test against 1.00 and fail a test against 0.85. If you run the old test, you are answering a question nobody asked.
How to run it properly in SmartPLS 4
The exact path, because the defaults will not give you what you need:
- Run the algorithm, then read the matrix at Quality criteria → Discriminant validity → Heterotrait-monotrait ratio (HTMT). The default threshold line in the chart is drawn at 0.85.
- Go to Calculate → Bootstrapping. Under Amount of results choose Complete (slower). This is the step people miss — the “Most important” setting does not output HTMT at all.
- Set 10,000 subsamples, Percentile bootstrap, test type One tailed, significance 0.05, and a fixed seed so your numbers are reproducible when a reviewer asks.
- Read the result at Quality criteria → Heterotrait-monotrait ratio (HTMT) → Confidence intervals bias corrected. With a one-tailed setup the bounds are reported in columns labelled 5% and 95%.
- Discriminant validity is supported when the upper bound is below your threshold.
A footnote worth putting in your methods chapter. Since version 3.2.1, SmartPLS computes HTMT using the absolute values of indicator correlations — an internal fix, sometimes called HTMT+, that keeps the statistic inside the 0–1 range when negative correlations are present. It is a small deviation from the formula as published in 2015. Nobody will fail you for it, but stating it shows you read past the tutorial.
What about HTMT2?
HTMT2 is a genuine improvement, proposed by Roemer, Schuberth and Henseler in 2021 in Industrial Management & Data Systems. The original HTMT assumes tau-equivalence — that all indicators of a construct load equally. Real congeneric measures almost never do, and the violation biases HTMT upward exactly where it matters, as the true correlation between constructs approaches 1. HTMT2 replaces the arithmetic means in the ratio with geometric means, which matches how loadings actually combine. It requires all indicator correlations to be positive.
So should you use it? Here is the practical problem: SmartPLS 4 does not implement HTMT2, and there are no plans to. Christian Ringle, one of SmartPLS’s creators, has said publicly that because HTMT2 differs only marginally in its results from the HTMT+ already implemented, another version will not be added.
If you want HTMT2 with confidence intervals, you need the cSEM package in R. For most Malaysian postgraduate theses, the honest advice is: run HTMT in SmartPLS, report it correctly with the bootstrap test, and cite Roemer et al. (2021) in your limitations if a reviewer is likely to be a methodologist.
What to do when HTMT fails
Hair et al. set out a staged response. Work down it in order — do not jump to the bottom.
- Fix the correlations, keep the constructs. Remove indicators that correlate weakly with their own construct’s items, or that correlate strongly with the other construct’s items. Only where theory supports it.
- Split the construct into homogeneous sub-constructs — possibly as a higher-order construct — if your measurement theory allows, then re-test discriminant validity against the rest of the model.
- Merge the two constructs into one broader construct, again only if theory supports treating them as one thing.
- Respecify or discard the model.
The warning attached to step 1 is the one people ignore. Hair et al. state plainly that eliminating items purely on statistical grounds can damage the content validity of the construct, and they recommend that at least two independent expert coders judge whether the remaining items still cover the construct’s domain before anything is dropped. Deleting three items until HTMT drops below 0.85 is not analysis — and a good examiner will ask you which items you removed and why.
The critique you should know about
If you are writing a methods-heavy thesis, read Rönkkö and Cho (2022) in Organizational Research Methods. Their argument is that HTMT is mathematically a disattenuated correlation of unit-weighted composites under a parallel measurement assumption — equal loadings and equal error variances — which is stricter than tau-equivalence and routinely violated. They reject fixed cutoffs altogether and propose confidence-interval procedures based on CFA instead.
You do not have to adopt their approach. But citing it, and acknowledging that 0.85 is a heuristic rather than a law, is the difference between a methods chapter that recites and one that reads.
What to actually write in your thesis
A reporting sentence you can adapt, covering everything an examiner will look for:
Discriminant validity was assessed using the heterotrait-monotrait ratio of correlations (Henseler et al., 2015). All HTMT values fell below the conservative threshold of 0.85. Following Franke and Sarstedt (2019), a one-tailed bootstrap procedure with 10,000 subsamples was used to test whether each HTMT value was significantly below 0.85; the upper bound of the 95% confidence interval did not exceed this threshold for any construct pair, supporting discriminant validity.
Change 0.85 to 0.90 only where you have said, in words, why the two constructs are conceptually similar.
Stuck on discriminant validity, or on what the output actually means?
We work with postgraduate researchers on measurement model assessment, PLS-SEM diagnostics and reporting results to journal standard — on your own data, in your own analysis.
Related: How to calculate sample size for PLS-SEM using G*Power.
Sources
Henseler, J., Ringle, C. M., & Sarstedt, M. (2015). A new criterion for assessing discriminant validity in variance-based structural equation modeling. Journal of the Academy of Marketing Science, 43(1), 115–135.
Franke, G. R., & Sarstedt, M. (2019). Heuristics versus statistics in discriminant validity testing: A comparison of four procedures. Internet Research, 29(3), 430–447.
Roemer, E., Schuberth, F., & Henseler, J. (2021). HTMT2 — an improved criterion for assessing discriminant validity in structural equation modeling. Industrial Management & Data Systems, 121(12), 2637–2650.
Rönkkö, M., & Cho, E. (2022). An updated guideline for assessing discriminant validity. Organizational Research Methods, 25(1), 6–14.
Hair, J. F., Hult, G. T. M., Ringle, C. M., & Sarstedt, M. A Primer on Partial Least Squares Structural Equation Modeling (PLS-SEM), 2nd and 3rd editions. Sage.
Ringle, C. M., Wende, S., & Becker, J.-M. (2024). SmartPLS 4. Bönningstedt: SmartPLS.
Software menu paths verified against SmartPLS 4 documentation in September 2026. Software changes — if a menu has moved, tell us and we will update this page.